Pre-Thanksgiving Winter Weather (Yes, Possible Snow)
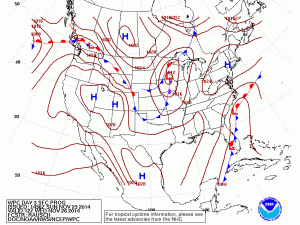
The forecast models have been hinting at the possibility of seeing some winter precipitation on Wednesday during peak travel time as everyone heads off to Grandma’s for Thanksgiving. Over the last 24 hours I have started to see more of an indication that this is a real possibility and could cause some major headaches Wednesday evening into early Thursday morning.
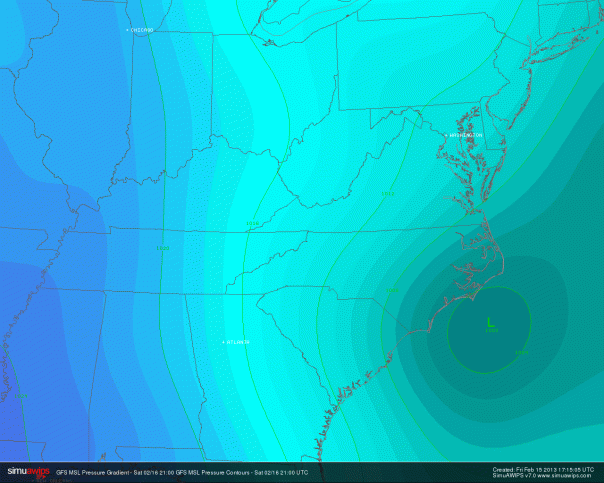
The culprit will be an area of low pressure that will develop off the Southeast coast. This area of low pressure will parallel the coast tracking to the northeast as cold air begins to spill in from the northwest. There are several factors that will be at play including the exact track/location of the center of the low, the timing of the arrival of the cold air and precip intensity.
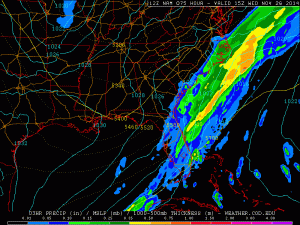
The three main models that I’ve looked at (NAM, GFS, EURO) all suggest a different solution with the GFS and the EURO being the most similar.
The NAM is the outlier as it takes the area of low pressure farther to the east keeping all of the precipitation out of the Triad. At this point it’s worth considering, but I have a harder time seeing this happen.
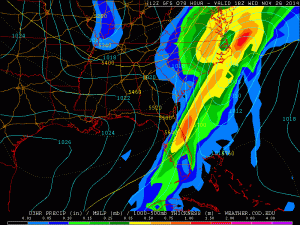
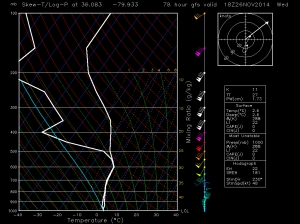
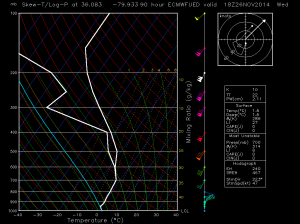
The GFS brings the low closer to the coast which would begin to bring the Triad rain as early as Tuesday night with the heaviest precipitation arriving Wednesday morning toward early afternoon. This is where the delicate recipe of variables begins to come into the play. As the precipitation arrives Wednesday morning temperatures will be above freezing at the surface. The upper levels, however, through late morning will likely be cold enough to produce snow. At first I would expect the snow to melt before it reaches the ground, continuing to bring just rain to the Triad. As the cold air continues to move in at the surface there will become a growing chance that snow could mix in with the rain if not completely change over to all snow.
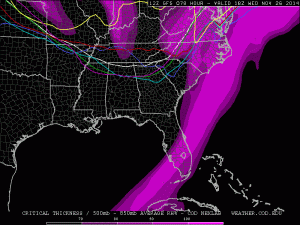
Right now, the GFS suggests that the Triad will see mostly rain with a brief period of snow mixing in as the precipitation begins to taper off. The lighter precipitation towards the end of the event would have a harder time dragging the cold air and the snowflakes down to the surface. The GFS definitely suggests a borderline setup that would likely bring us rain with just a few flakes mixing in at the end. This is represented well by the critical thicknesses.
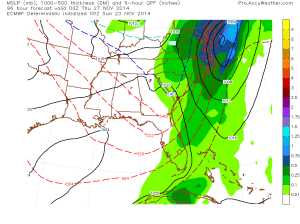
The EURO has a similar placement/track of the low as the GFS if not just slightly farther to the west. The EURO is definitely the most aggressive in bringing the Triad the most precipitation as a whole. The EURO also brings the colder air into the area sooner. These combined factors would lead to a greater chance of snow falling in the Triad through the afternoon. Not only does the EURO bring the cold air in a little sooner, the heavier precipitation would have a greater chance of pulling some snow flakes down to the surface earlier on to mix with the rain. This would set the stage for temperatures at the surface to be more supportive of accumulating snow earlier in the day before the precip begins to move out.
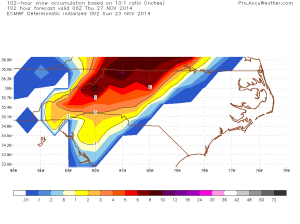
With the EURO supporting the idea of snow the most it, of course, paints some accumulations over the area. Here is its suggestion for how much snow ‘COULD’ fall.
MY THOUGHTS:
Right now my confidence is still relatively low in exactly what we see in the Triad. That being said, I am currently leaning toward something in between the GFS and the Euro.
I would plan to expect some light scattered rain showers to arrive Tuesday night into the Wednesday morning. The intensity will likely begin to increase through Wednesday morning as cold air slowly starts to move in. I would not be surprised to see snowflakes mixing with the rain by midday with possibly even a changeover to all snow as the precipitation begins to move out Wednesday evening.
Temperatures through Wednesday will hold in the low 40s before dropping into the 30s through Wednesday evening. Wednesday night temperatures will drop into the upper 20s to low 30s. This will result in any precipitation (rain or snow) to potentially freeze on roads. Luckily, temperatures will be warm enough to where roads crews should be able to mitigate a lot of that threat through salting. Unfortunately, the fact that rain will be the initial precip type brining will not be an option.
The cold air will be arriving earlier in the foothills and mountains which, naturally, will provide a better chance of receiving snow and likely accumulating snow (2-4″+ in the mountains).
My main concern for the Triad will be for the evening commute Wednesday Evening and Thursday morning. Make sure you look for the latest update on Facebook and twitter. The details will continue to evolve through Wednesday morning.
2014 Atlantic Hurricane Season: Not As Quiet As You Might Think
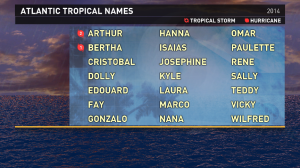
We are well into Hurricane Season (started June 1st) and many people have already started commenting how that this season is really quiet. If you are one of those people I have to stop you right there. You’re probably thinking, yes I remember Hurricane Arthur (June 30 – July 5) and how it hit North Carolina’s Outer Banks, but that’s it. Okay, okay….you actually didn’t blink and you watched Hurricane Bertha (July 31 – August 6) parallel the eastern seaboard, but that storm really didn’t generate much interest from the U.S. Oh wait, but in between those two NAMED storms there was also Tropical Depression #2 that tried to develop from July 21 – July 23, but it just couldn’t get strong enough to be become a tropical storm. There have also be a few other tropical waves that became tropical invests, but never amounted to much more than some thunderstorms.
So, here we stand about half-way through August and I’m telling you that there have only been three tropical depressions, two named storms and a few clusters of thunderstorms that were monitored for ‘potential’ development. I’m also going to stand here and tell you that this isn’t that uncommon. While much of the focus this hurricane season has been on the incredibly active Eastern Pacific (11 named storms, 6 hurricanes and 5 major hurricanes), the Atlantic Season doesn’t typically begin to really ramp up until late August into the middle of September.
According to data from 1966-2009 the Atlantic Hurricane Season typically expects to see it’s third named storm by August 13th; which this year is only behind by 1 named storm. Having two hurricanes this early in the season, however, is a little ahead of schedule. According to the averages the Atlantic Basin doesn’t typically produce two hurricanes until August 28th.
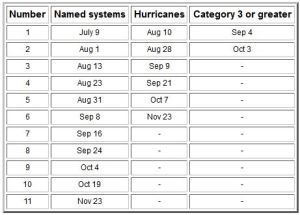
Progress of the average Atlantic season (1966-2009). Date upon which the following number of events would normally have occurred. (Source: NOAA)
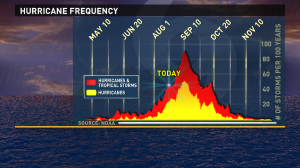
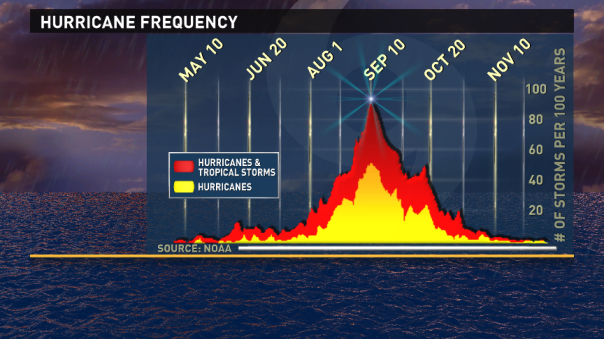
It’s important to remember that the Atlantic Hurricane Season runs through the entire month of November with the peak of activity occurring on September 10th.
As we enter the peak of the Atlantic Hurricane Season the entire Atlantic Basin must be watched for the potential of producing a tropical cyclone.
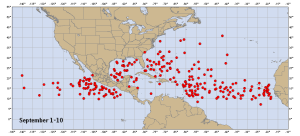
Points of tropical cyclone genesis for Sept. 1-10 in past seasons (1851-2009). These points depict named storms only; no subtropical storms or unnamed storms. (Source: NOAA)
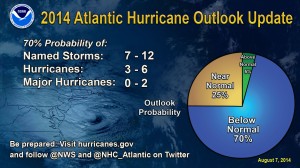
All of this being said, the forecast remains for the number or storms this season to be below normal. The National Oceanic and Atmospheric Administration (NOAA) recently updated their Atlantic Hurricane Outlook to call for 7-12 Named Storms, 3-6 Hurricanes and 0-2 Major Hurricanes. This below normal season is expected partially due to a developing El Nino pattern which tends to inhibit tropical cyclone development in the Atlantic.
Regardless of the forecast or the trend of the season so far, it only takes one storm to make a major impact. This is the time of year for even inland residents to stay aware of what is brewing in the tropics. While the tropics are quiet right now we still have a long season ahead.
Freezing Rain Threat Thursday Night
After the early week winter storm that hit the Triad on Monday we are already putting a lot of focus at another winter storm that could hit the Triad Thursday into early Friday morning. The setup advertises an area of high pressure that would build over Vermont, New Hampshire and Maine and push cold air south along the eastern side of the Appalachians and into the Triad on Thursday. Meanwhile a disturbance will develop out of the eastern Gulf of Mexico and build east and strengthen as it advances over the Florida Peninsula and over the Gulf Stream off The FL, GA, SC coast. Computer models have been fairly inconsistent in resolving the strength and location of both the high pressure system and the low pressure system which will ultimately determine how much precipitation we see and what TYPE of precipitation we see. The latest model data Tuesday evening is beginning to show a growing threat for accumulating freezing rain through Thursday night into Friday morning in the Triad. While there could be an initial flurry or mixed wintry precipitation Thursday afternoon, the greatest winter precip threat would come from freezing rain Thursday night when temperatures dip below freezing.
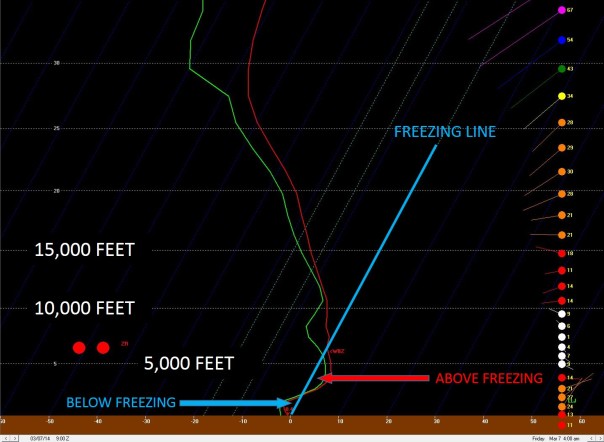
The cold air from the high pressure system to the north will be pooling at the surface as the moisture and more mild temperatures ride up from the south with the developing area of low pressure. This relatively warm air associated with the approaching precipitation creates that warm layer above the surface that would cause any precipitation over the Triad to fall as rain and then fall into potentially sub-freezing temperatures at the surface (Figure 1).
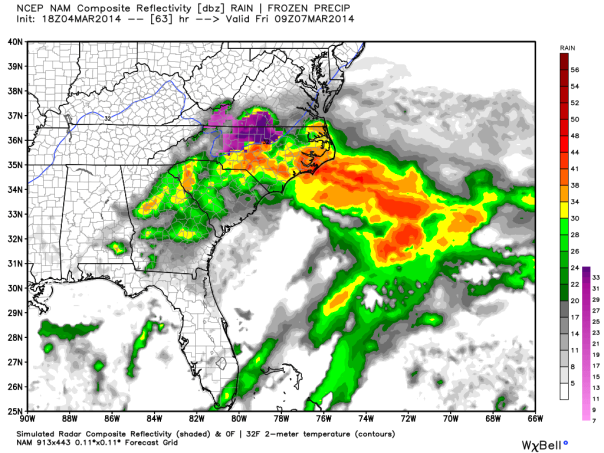
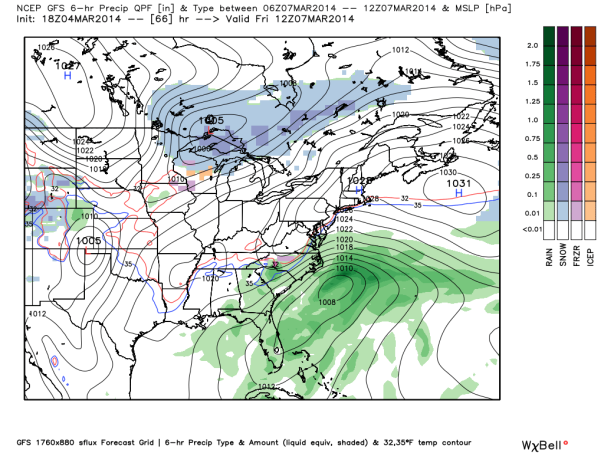
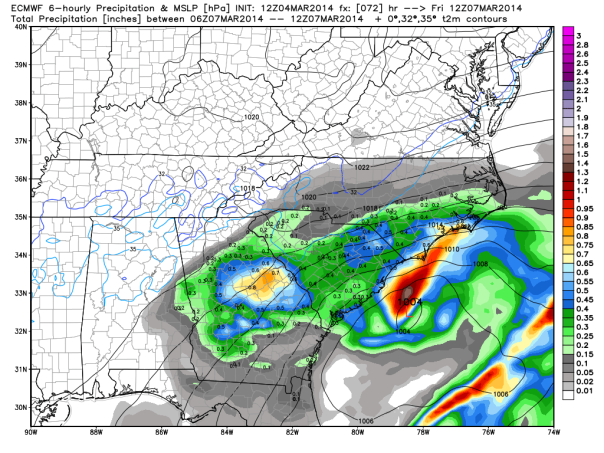
A collection of the models are beginning to indicate that there will be at least a brief period Friday morning where freezing rain will likely be the case. As you can see in the images below the NAM, GFS and EURO suggest winter precipitation early Friday morning which would likely be in the form of freezing rain. Notice how in all of the images the 32° line is south of the Triad.
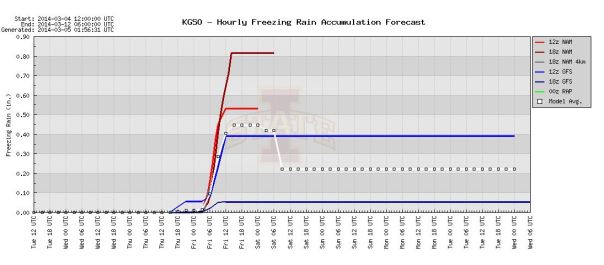
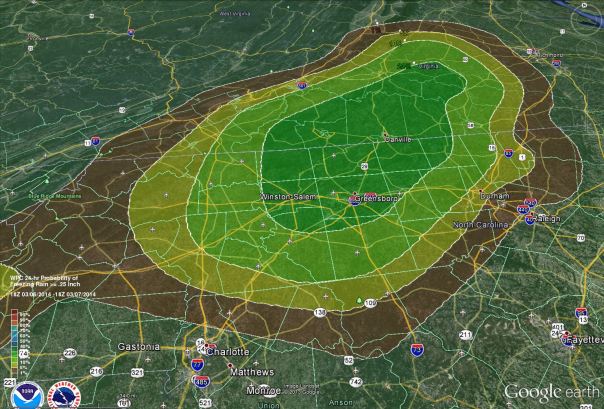
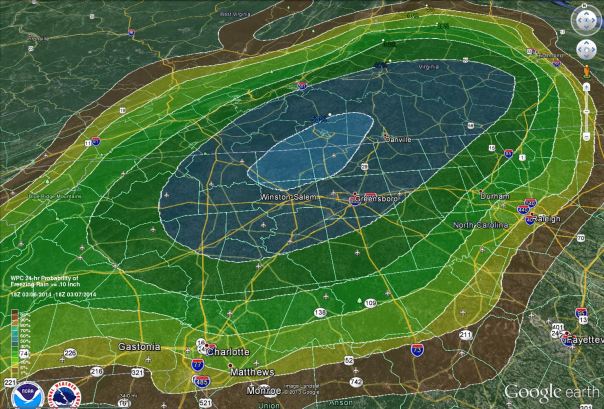
If this occurs, ice accumulation will be possible and the question shifts to how much ice accumulation could we see. The amount of freezing rain depends on just how long temperatures stay below freezing and how much precipitation falls during that period. An exact period is hard to determine considering temperatures Thursday night into Friday morning will likely hover around that 30°-32° range. On the extreme end models are beginning to suggest that at least 0.10″ of ice accumulation is likely with greater amounts possible. The model average as of Tuesday night was somewhere around 0.45″ (Figure: 4), which is definitely enough to cause tree’s and power lines to become compromised resulting in loss of electricity. Again, it all depends on what the temperatures are like at the surface and aloft to what type of precipitation we see at the ground. Tuesday night’s SREF Plumes indicated, what I think, is a good representation of how we see the p-type play out (Figure: 5). At this point anything greater than a 0.25″ of an inch does not seem likely, but some accumulation is starting to become a greater possibility. The latest freezing rain probabilities from the National Weather Service illustrate the locations with the best chance of seeing accumulation very well (Figure 6&7).
There remains a fair amount of uncertainty at this point as the models have been relatively inconsistent. If the models continue to show a little more agreement by Wednesday afternoon we should have a decent idea of how everything should come together. In the meantime this is how it looks right now. I’ll have many more updates on facebook (www.facebook.com/grantgilmore) and twitter (@grant_gilmore).
Until next time…
Grant
Give The Gift Of Weather Preparedness
A viewer recently emailed me and told me that they were looking to purchase a Weather Radio as a gift for Christmas and wanted to know what kind I recommend. I will say right off the bat that I recommend ANY NOAA (National Oceanic and Atmospheric Administration) Weather Radio and giving it as a gift is a great way to give something that could potentially save somebody’s life.
The first thing you’ll want to make sure of when purchasing a NOAA Weather Radio is that it is actually a “NOAA Weather Radio All Hazards” Weather Radio. I’ve seen some knock off ‘Weather Radios’ that advertise as giving weather conditions, but don’t actually alert you when the National Weather Service issues weather alerts. The NOAA Weather Radio All Hazards (NWR) is a nationwide network of radio stations broadcasting continuous weather information from the nearest National Weather Service Office. For us in the Piedmont Triad that could be Raleigh, NC, Greenville, SC or Blacksburg, VA. The great thing about NWR is that it broadcasts warning and post-event information for all types of hazards including natural events such as earthquakes, environmental accidents and public safety issues. There are seven frequencies that are consistent throughout all 50 states , adjacent coastal waters, Puerto Rico, the U.S. Virgin Islands, and the U.S. Pacific Territories transmitted from 1,000 transmitters. So, once you own a NOAA Weather Radio you can receive alert information anywhere in the U.S.
So, what NOAA Weather Radio do you purchase? Ultimately it is up to you and how you think you will get the most out of it. Buy something that you think you (or who you are buying for) will use. So often people buy a NOAA Weather Radio and it just ends up sitting in the corner… collecting dust. A dusty, unplugged NOAA Weather Radio cannot and will not save your life. The reason many people end up storing the radio in the corner is because it alerts for every single weather alert seemingly within a 100 mile radius. This occurs when you purchase one of the more economical radios. They are still effective, but they simply scan the seven frequencies for alerts. So, anytime there is an alert on anyone of the those frequencies you’ll get it.
Enter S.A.M.E. Technology:
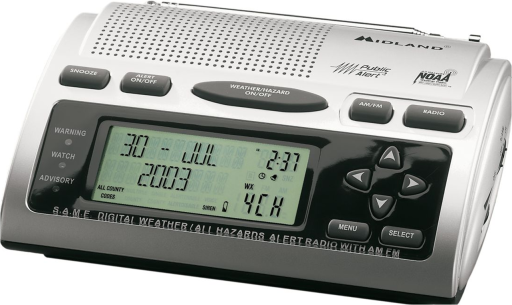
S.A.M.E. stands for Specific Area Message Encoding and if you have a Weather Radio equipped with this technology it will allow you to program the alerts to only sound for your area. I highly recommend paying the extra money for a radio that has the S.A.M.E. technology because this ensures that you only receive the alerts for your area. These radios require a little programming, but most radios come with good instruction manuals for how to program them. Here is a list of S.A.M.E. codes for North Carolina.
In addition to the basic Hazards Alert function, different radios come equipped with an array of additional features such as, power cranks, solar power panels, AM/FM Radios, cell phone charges, etc… The more add on’s usually means the more $$ that you will end up paying. But again, buy something that you’ll use!!
WHAT TO BUY:
You can purchase a basic Midland NOAA Weather Radio at your local corner drug store. I know Walgreens and CVS usually have them. The basic Midland NOAA Weather Radio will usually cost around $20.
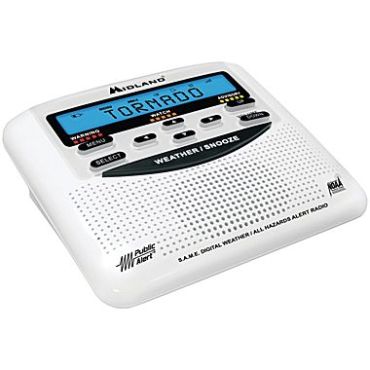
If you want to go for the S.A.M.E Technology of the Midland NOAA Weather radio it runs for around $50, but I have seen it on sale for as low as $35.
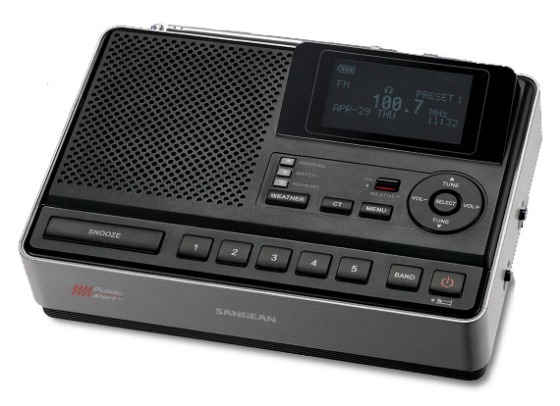
I also recently came across this Sangean’s compact Table-Top S.A.M.E. Weather Alert Radio. It’s a little more expensive, but looks like it might be worth it. This version costs around $70.
If you search online you can find radios at places like Radio Shack, Cabela’s, Bass Pro Shop, Walmart and other outdoor/electronic stores. You can also find some good radios online at the Red Cross store. You will find a good assortment of radios online, but remember to keep an eye out for the NOAA Weather Radio All Hazards and if you prefer the S.A.M.E. technology.
I’m always interested to hear what type of radio people purchase and what they think of it after it has been used. So, let me know!
If you have any questions about weather radios please don’t hesitate to ask. Send me an email at ggilmore@wfmy.com find me on facebook or twitter.
Until next time…
Grant
Summer 2013; Take It Or Leave It
While the official end of summer is not until the Autumnal Equinox of September 22, meteorological summer ended on August 31st. As we look back on summer 2013 there is one thing that really seemed to be missing; HEAT!
In terms of high temperatures the Triad had the 6th coldest summer on record (1903-2013). The average high temperature from June 1 – Aug. 31 was 83.8° which was 2.5° cooler than normal. The summer with the coldest average high temperature was in 1976 when that year experienced an average high temperature of 83.2°. Yes, only .06° cooler that this summer.
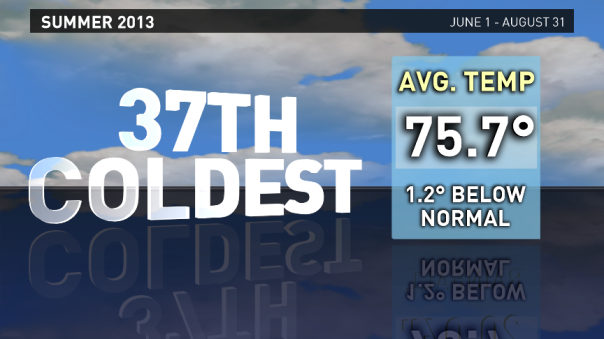
When you average out the high and low temperatures this past summer we had the 37th coldest summer with an average high temperature of 75.7° which was 1.2° cooler than normal. The coolest summer ever recorded in the Triad was in 1929 when the average temperature was 73.2°.
What really might surprise you (or maybe not) is that the hottest temperature that the Triad experienced this summer was only 93° which occurred on July 16th. For comparison, 100° was the hottest the Triad reached in 2012. As we head through September we are not likely to surpass that 93° mark, but it is possible to see a couple more 90° days. To this point, however, the Triad has only seen 11 days with temperatures at or above 90°. In 2012 the Triad had 36 days with 90° temperatures. The normal number of 90° days through Aug. 31st is thirty one.
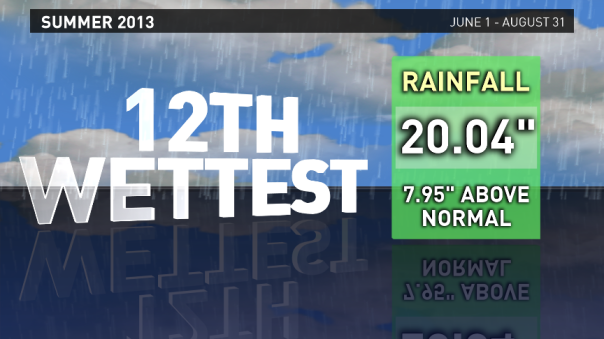
Though much of summer 2013 seemed to be spent dodging raindrops it wasn’t a record setting summer for rain. Summer 2013 ended up only being the 13th wettest summer on record in the Triad with 20.04″ of rain (7.95″ above normal). The wettest summer on record was way back in 1906 when 24″ fell. The Triad did, however, have a couple of big rains within a 24-hour period. The largest come between the 17th-18th of August when a total of 3.06″ of rain fell.
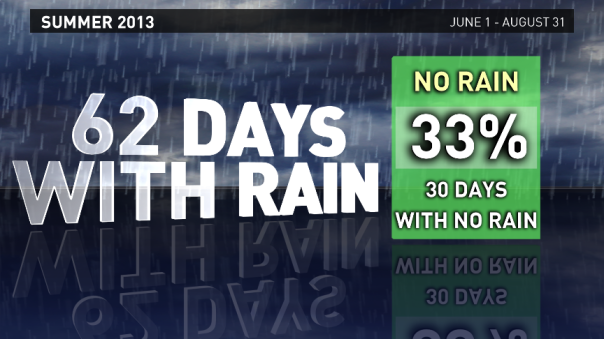
The real kicker though was the number of days with rain, not necessarily the amount of rain. The Piedmont Triad International Airport only had 62 days with measurable rainfall through the entire summer. Translation… there were only 30 days sprinkled throughout the summer without rain.
As for 2013 as a whole, it is currently the 12th wettest year on record with a total of 39.38″ of rain which is 10.29″ above normal. And for the record, 2013 has been the 40th coldest year on record (not really that impressive).
2013 won’t be necessarily be looked back on as the best summer ever, but all-in-all I wouldn’t say it was that bad.
Until next time…
Grant
The Heat Of July Arrives!
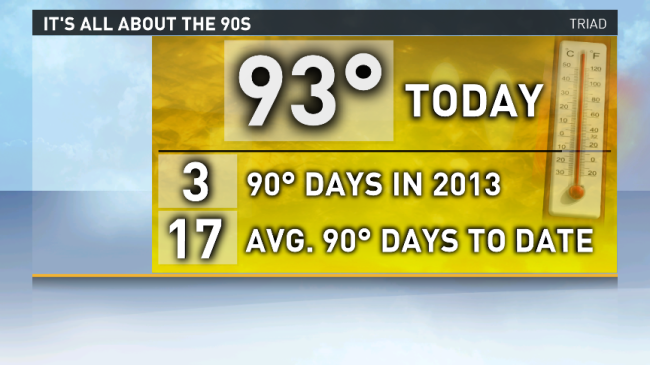
It’s taken 16 days, but the 90 degree heat that we associate with July has finally arrived. Tuesday’s high temperature of 93° was only the 3rd 90° day of 2013 and the first in July. The only other 90° days came on June 12th & 13th when the highs were 90° & 92° respectively. The record for fewest number of 90° days through July 16th is 2 which was set in 1912.
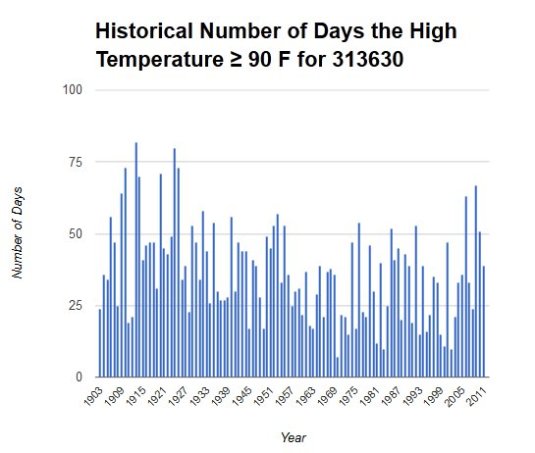
By this point in the year the Triad typically sees 17 days of 90° heat with an average of 37, 90° days for the entire year. While we have seen a very few number of 90° days this year we will likely not break the record for the fewest number of 90° days with at least 3 more days this week with forecast high temperatures at or above 90°. The record lowest number of 90°+ highs in a calendar year is 7 which was set in 1971. Impressively, the greatest number of 90° days in the Triad was 82 which was during the sweltering year of 1914.
Regardless of all of these numbers the heat is here and here to stay for the rest of the week. Take it easy and try to stay cool.
Until next time…
Grant
Oh It Rained… The Triad Barely Stays Afloat
July is now half over, but the National Climatic Data Center just released their June ‘State of the Climate Report’ and it contained some interesting trends.
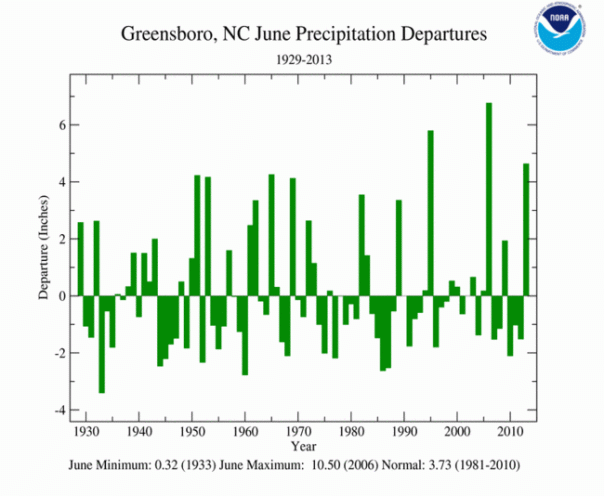
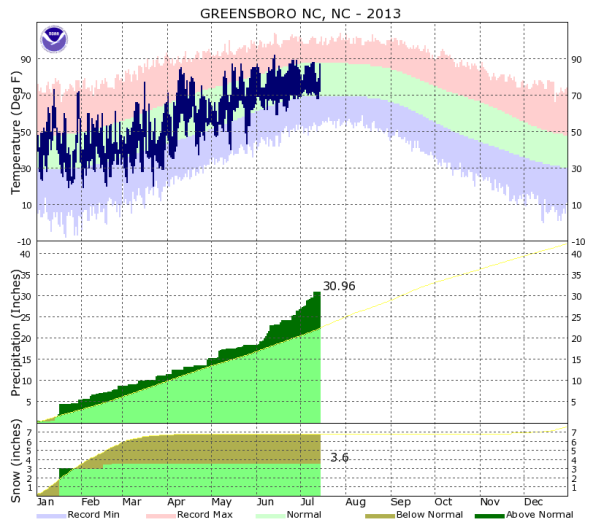
First and foremost, after coming off of an incredibly wet pattern that just ended today (Monday, July 15th) June was when it all began. For us in the Triad our 21 of 22 day stretch of rain started back on June 23rd. In total the Triad accumulated 6.86″ of rain. Ironically, there wasn’t one daily rainfall record broken. The greatest rainfall amount came on July 10th, however, when 1.40″ fell with most of it coming within just a couple of hours. As for the entire month of June the Triad received a total of 8.37″ of rain, which was 4.64″ above normal. The last time the Triad had a surplus in June was in 2009 when 5.67″ fell.
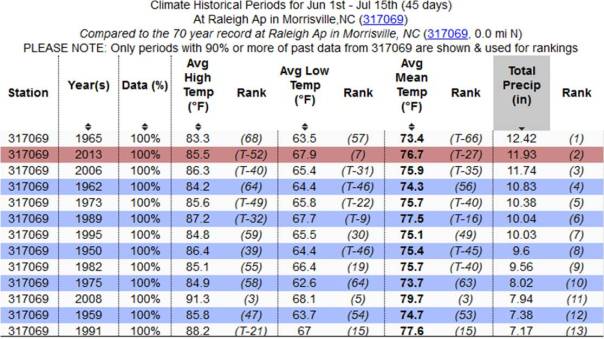
To date, the Triad has had it’s second wettest summer on record dating back to 1944 with 11.93″ of rain. The wettest summer, to date, was in 1965 when 12.42″ of rain had fallen.
For the entire year the Triad has received 30.96″ of rain which is 8.48″ above normal. Except for the first half of January, the Triad has had a surplus of rainfall all year that all started with an impressive 2.45″ of precipitation that fell on January 17th (3″ of snow).
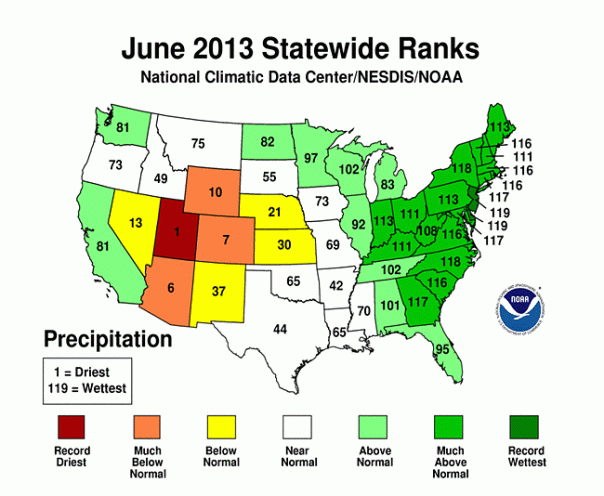
North Carolina as a whole also had a very wet June that obviously continued into the first half July. In fact, North Carolina had its second wettest June on record dating back to 1894. The first half of the year (Jan-June) was also pretty wet where it was the 9th wettest on record.
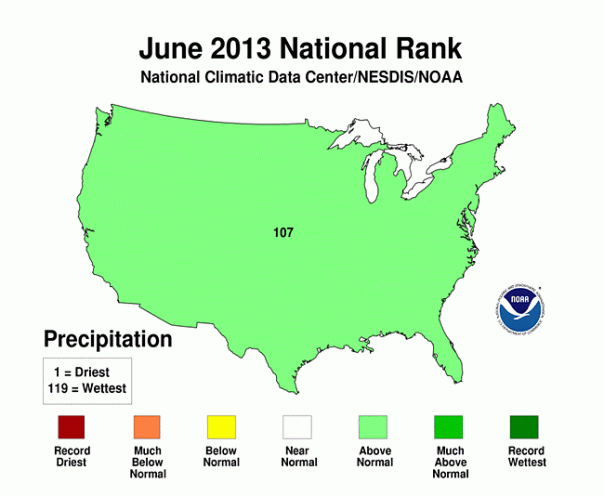
As a nation, it was the 13th wettest June on record.
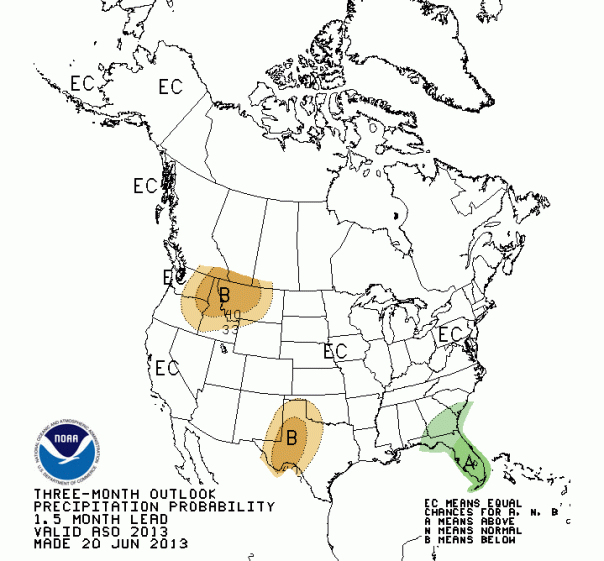
As we look ahead to the rest of July and into the late summer and early fall months there are no indications that we will enter another wet pattern similar to what we just came out of. The Climate Prediction Center has given North Carolina equal chances of below or above normal amounts of precipitation. And while drought is the last thing that we need, a little bit of dry weather wouldn’t be such a bad thing around here. Case in point, in the last 30 days the Triad has received more than 200% of it’s normal rainfall!
While the long term prediction is for an equal chance of above or below normal amounts of precip, we will still have to watch out for the tropics. A single tropical storm could reek havoc on North Carolina, not necessarily with winds, but with the potential for days of torrential rains. So far (knock on wood) the hurricane season has been relatively quiet with only three named storms. Don’t let the low number fool you, however, the peak of hurricane season is not until September 10th. We still have a long way to go!
As for right now, enjoy the return to somewhat of a normal weather pattern in the Triad with that fairly persistent 30% chance of afternoon scattered showers and thunderstorms.
Until next time…
Grant
Heavy Rain Means Trouble On The River
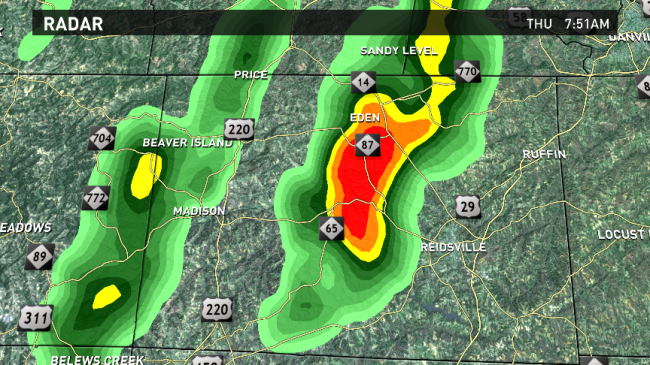
Here in the Triad the chance of showers and thunderstorms on the 4th of July is just as expected as fireworks and cookouts. This year, however, heavy rain created a very dangerous situation on the Dan River in Rockingham County Thursday morning.
At 7:00 am Dan Rivers Adventures, a local tubing company, made the decision that the river was safe for tubers to take to the river. By 7:45 a.m. a train of moderate to heavy showers were moving over Stokes and Rockingham County. Meanwhile, a group of tubers had taken to the river for what was supposed to be a fun and relaxing trip down the river. That all changed when conditions on the river rapidly deteriorated. Between 9 a.m. and 10 a.m. an emergency phone call was made reporting distressed tubers. Fortunately, the Madison Rescue Squad retrieved 15 people from the river where they encountered unmanageable swift waters. Here’s a link to the story on digtriad.com.
I looked back at the records of a gauge in the Dan River near where the tubers were rescued. What I found was pretty shocking.
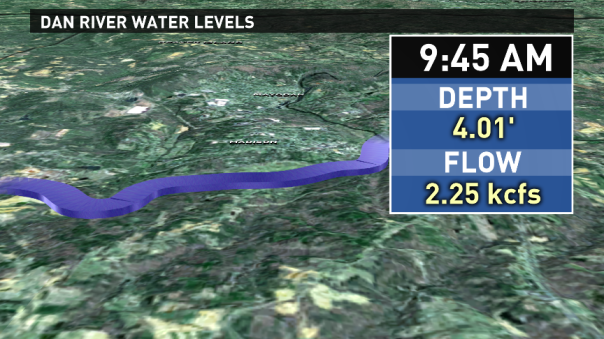
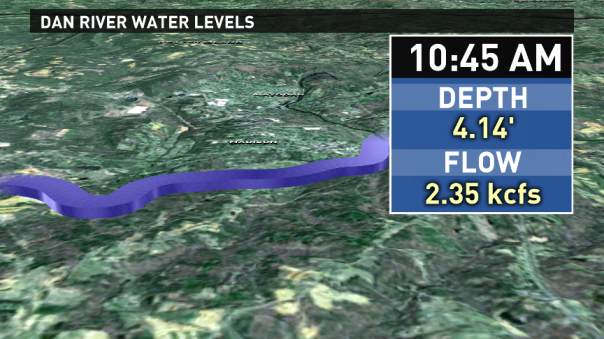
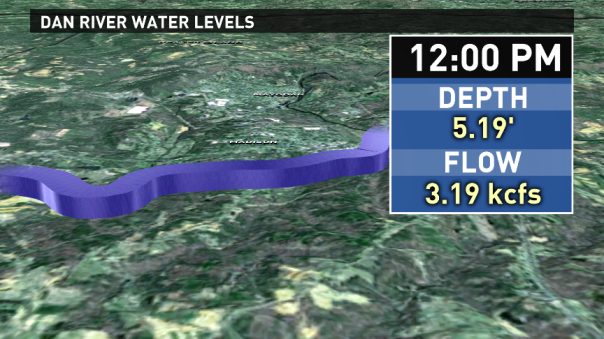
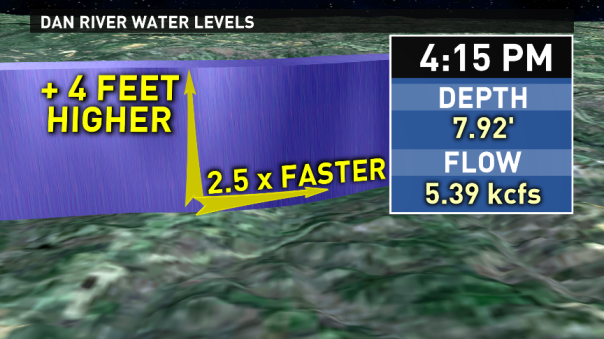
The heaviest of the rain in the area Thursday morning occurred around 7:45 a.m. Now, there is always a delay in water rise in rivers after a heavy rain because it takes time for the rain water to runoff into the river from the surrounding land. At 9:45 a.m. the river gauge near Wentworth reported a water level of 4.01′ and a flow rate of 2.25 kcfs (1,000 cubic feet per second). An hour later the river had risen to 4.14′ and the flow rate increased to 2.35 kcfs. Then, a little more than an hour later (12 p.m.), the river had risen to 5.19′ with a flow rate increasing to 3.19 kcfs. The river continued to rise and the flow rate continue to increase through the day before it crested at 4:15 p.m. at 7.91′ with a flow rate of 5.30 kcfs. In the end, the river rose about 4 feet and increased nearly 2.5 times in speed. Here is a link to the actual gauge readings.
After looking at the rapid change in conditions on the river it is no surprise that the tubers ran into issues. And I’ll be honest, this was a sobering reminder of just how quickly conditions can change on a river even if the weather isn’t necessarily bad in your area. Whenever you are out on the river you need to pay attention to what the weather is like upstream as all of the runoff water will feed into the river and build downstream. In then end, fortunately nobody was injured and hopefully we all can learn a lesson from this example of how closely connected the river conditions are to the weather.
Until next time…
Grant
A Particularly Dangerous Situation (PDS)
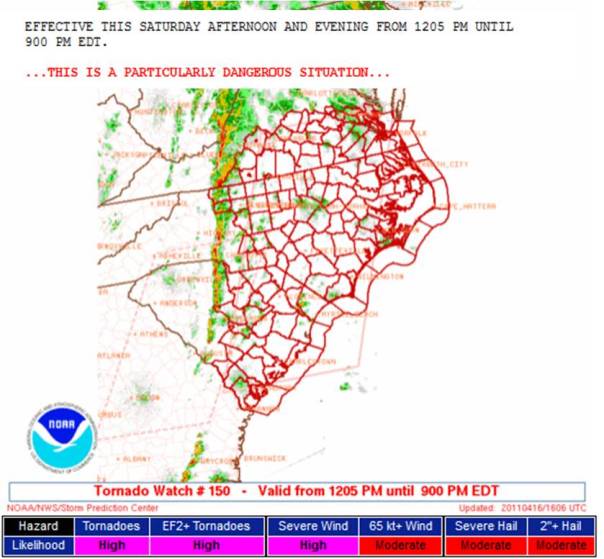
Many of us vividly remember Saturday, April 16, 2011. This was the day of one of North Carolina’s largest tornado outbreaks in recorded history. A total of 30 tornadoes touched down in our state that day with five EF-3, eight EF-2, nine EF-1 and eight EF-0 tornadoes.

Perhaps more notably and unfortunately a total of 24 people lost their lives as a result of the classified ‘strong’ tornadoes. In addition to the 24 fatalities there were 304 injuries reported in central North Carolina. The Sanford-Raleigh Tornado had more than 100 injuries alone. The estimated structural damage in central North Carolina was $328,610,000 with the Sanford-Raleigh tornado producing roughly $172,075,000 in damage. Obviously this outbreak was not only record-breaking, but certainly devastating in many aspects where lives were changed forever.
I wanted to lay out what resulted from that day because at 12:05 pm that day PDS Tornado Watch was issued for the Triad and points east. A PDS is a Particularly Dangerous Situation Watch is issued when the forecasters at the Storm Prediction Center in Normal, OK have a high confidence that multiple strong to violent tornadoes will occur in the warned area. These watches are incredibly rare and comprise roughly only 3% of all Tornado Watches issued. In fact, there has not been a PDS Tornado Watch issued for North Carolina since April 11, 2010.
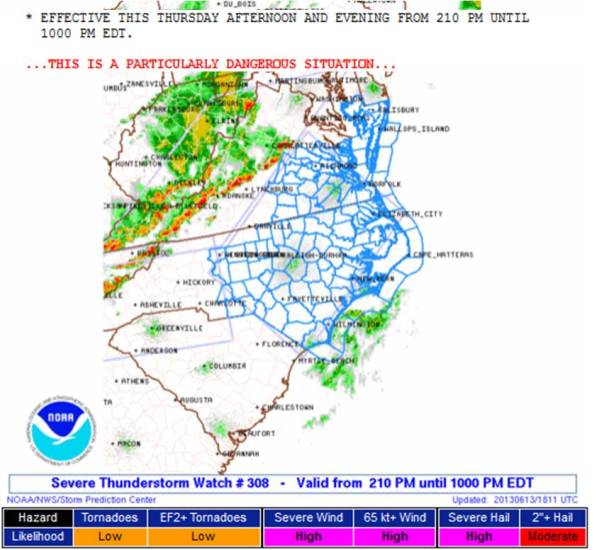
However, on Thursday a PDS Severe Thunderstorm Watch was issued for the Triad and points east. A PDS Severe Thunderstorm Watch is even more rare than and PDS Tornado Watch. PDS Severe Thunderstorm Watches are only issued when there is a threat of a high-end “derecho” with widespread wind damage. Which is exactly what occurred Thursday afternoon and evening.

I spoke with the Warning Coordination Meteorologist with the National Weather Service Office in Raleigh on Friday and he said that he does not recall a PDS Severe Thunderstorm Watch ever being issued for our area. We are in the process of coordinating with the Storm Prediction Center to determine just how many PDS Thunderstorm Watches have ever been issued.
But I digress… The reason I bring all of this up is because there seems to be a certain level of complacency that is taken with regard to severe thunderstorms. At least up until Thursday. The line of storms that raced through the Triad was moving at speeds greater than 60 mph, packing wind gusts estimated around 70 mph, producing 1″-2″ diameter sized hail and individual storms with more than 1,000 lightning strikes in less than 10 minutes. Not to mention the non-severe side of things where the temperature at the Piedmont Triad International Airport dropped 23° in 45 minutes as the storms rolled through.
link to rapid-scan visible satellite loop of Thursday’s storms
After the storms passed over Central North Carolina was left with more than 100 severe storm reports and more than 130,000 people without power. Through all of this there was not ONE tornado warning issued in the Triad, but the entire area was under a severe thunderstorm warning at some point. And at the time of this post there have been three people who have died as a result of the storms.

While Thursday’s event was incredibly rare it is a good reminder that severe thunderstorms must be respected. So often severe thunderstorm warnings are issued and that warning of potentially dangerous weather is ignored because it is not a ‘Tornado Warning’. While tornadoes produce a heightened threat of danger we have to remember that there is a reason the National Weather Service is issues a warning. The reason for a warning is that the weather conditions associated with a particular storm possesses the threat to cause damage to life and property.
So, let’s all let Thursday be a reality check to remind us that regardless of a Tornado, Severe Thunderstorm or even Flood Warning we must heed the warning. If there is one thing that I have learned in my years of forecasting and tracking severe weather that is that you must ALWAYS respect the dynamic and sometimes tumultuous nature of the atmosphere.
Until next time…
Grant
The Complexity of Saturday’s Snow Forecast
Even as we head to within 24 hours of when we could see some snow in the Triad there is still a lack of confidence in exactly how things are going to play out. The reason is quite simple really, and it is because the area low pressure system that is going to provide the moisture is just now beginning to develop.
Typically when we forecast storm systems we can track their movement and development and make predictions of how other features in the atmosphere are going to influence the behavior of said storm system. This is where computer forecast models come into play. The models take the state of the atmosphere at that given moment and incorporate our understanding of how different elements in the atmosphere interact with one another through time and make a prediction of how the weather will change going forward. There are many issues that lead to forecast error including, but not limited to, incorrect data, lack of data, limit of model resolution (just like poor television resolution) and that the atmosphere is constantly changing.
As we try to pin down the details of Saturday’s potential snow event we are faced with trying to predict the characteristics of a storm system that hasn’t even developed yet. The elements of the forecast challenge are tri-fold. The first element is a disturbance that is swinging down from the northwest embedded in a larger upper-level trough of low pressure. At the surface, polar air is tracking to the southeast that will begin to move into the Triad Friday night. Thirdly, there is an area of low pressure that will develop off the Carolina coast.
The disturbance that is swinging in from the northwest will merge with the surface area of low pressure off the coast. The difficulty in forecasting this merger is that we simply don’t know exactly where or how quickly this is going to happen. When and where this occurs will greatly determine how strong that system is able to become and ultimately where is will track.
As this storm system develops off the coast it will send moisture to the west which will interact with the polar air spilling into the eastern U.S. The farther to the west this low develops the greater chance of snow will shift to the west. If the storm delays its development or develops farther to the east the area of snow will shift to the north and east.
Needless to say, this particular forecast does come with a certain degree of difficulty and has present a challenge to forecasters everywhere. Keep an eye out on my Facebook, twitter accounts and WFMY News 2 as we work out the forecast details leading into weekend.
Until Next Time…
Grant
